The latest 30 years means have been published by the Met Office. The period covers the 30 years between 1991-2020 and will be used going forward as a representative of climate norms. The figures show a warming of about 0.3 degC overall, particularly in late winter/spring, with a slight increase in sunshine, but also wetter, particularly the 2nd half of the year.
Durham’s new figures are below (previous 1981-2010 figures in parentheses)
January
January has warmed, and the mean maxima and minima are 0.3-0.4 degC higher. This has resulted in one day less air frost on average. Sunshine is up slightly, but rainfall is similar.
Mean Max: 6.9 degC (6.6)
Mean Min: 1.3 degC (0.9)
Mean: 4.1 degC (3.8)
Air Frosts: 10.3 days (11.3)
Sunshine: 60.9 hrs (58.6)
Rainfall: 51.8 mm (52.3)
Days rain: 11.8 days (11.4)
February
February has warmed substantially, with the mean maximum being 0.6 degC up from the 1981-2010 mean. The mean minimum is also 0.5 degC higher. This has resulted in a reduction of air frosts from 11.2 to 9.8 days on average. It has also become slightly sunnier and slightly wetter.
Mean Max: 7.8 degC (7.2)
Mean Min: 1.4 degC (0.9)
Mean: 4.6 degC (4.1)
Air Frosts: 9.8 days (11.2)
Sunshine: 84.4 hrs (80.3)
Rainfall: 44.6 mm (41.8)
Days rain: 9.9 days (9.3)
March
March shows a warming, more in the mean maximum than the mean minimum. This hasn’t made much difference to air frosts, but sunshine has increased and it is a little drier.
Mean Max: 9.9 degC (9.5)
Mean Min: 2.5 degC (2.3)
Mean: 6.2 degC (5.9)
Air Frosts: 6.5 days (6.7)
Sunshine: 121.7 hrs (115.5)
Rainfall: 41.1 mm (44.6)
Days rain: 8.6 days (9.7)
April
April has become markedly warmer, particularly in the mean maximum. The high is now 0.6 degC higher. This means that air frosts are now down to 3 days from 4. Aprils have also been sunnier, with little change in rainfall.
Mean Max: 12.5 degC (11.9)
Mean Min: 4.1 degC (3.7)
Mean: 8.3 degC (7.8)
Air Frosts: 3.2 days (3.9)
Sunshine: 160.8 hrs (150.3)
Rainfall: 51.2 mm (52.7)
Days rain: 9.1 days (9.5)
May
May has followed the trend of warming, with both max and min being up by 0.4 degrees on average. We can still expect one air frost on average. Again, sunshine is slightly up, but there has been little change to rainfall.
Mean Max: 15.4 degC (15.0)
Mean Min: 6.5 degC (6.1)
Mean: 11.0 degC (10.5)
Air Frosts: 0.8 days (0.8)
Sunshine: 187.1 hrs (181.7)
Rainfall: 44.4 mm (44.2)
Days rain: 8.6 days (9.2)
June
June temperatures are up by 0.3-0.4 degC on average and it has become slightly wetter.
Mean Max: 18.0 degC (17.6)
Mean Min: 9.3 degC (9.0)
Mean: 13.7 degC (13.3)
Air Frosts: 0.0 days (0.0)
Sunshine: 167.1 hrs (164.8)
Rainfall: 61.0 mm (55.4)
Days rain: 9.9 days (9.7)
July
July hasn’t shown much change other than a slight increase in mean minimums, but has become slightly wetter and rain comes on two more days.
Mean Max: 20.2 degC (20.1)
Mean Min: 11.3 degC (11.1)
Mean: 15.8 degC (15.6)
Air Frosts: 0.0 days (0.0)
Sunshine: 174.3 hrs (172.3)
Rainfall: 60.9 mm (54.0)
Days rain: 10.7 days (9.0)
August
Again, the slight increase in temperature in August is due to the mean minimum, with a similar effect to July, a slight increase in rainfall and an average of nearly a day extra with rainfall.
Mean Max: 19.9 degC (19.8)
Mean Min: 11.3 degC (11.0)
Mean: 15.6 degC (15.4)
Air Frosts: 0.0 days (0.0)
Sunshine: 167.3 hrs (167.3)
Rainfall: 66.5 mm (60.8)
Days rain: 10.3 days (9.6)
September
September is slightly warmer by 0.3 degC, but other than that the other parameters haven’t changed.
Mean Max: 17.4 degC (17.2)
Mean Min: 9.3 degC (9.0)
Mean: 13.4 degC (13.1)
Air Frosts: 0.0 days (0.0)
Sunshine: 135.3 hrs (134.5)
Rainfall: 56.9 mm (55.4)
Days rain: 9.4 days (9.3)
October
October has warmed slightly and has become slightly duller, with an extra day of rain on average.
Mean Max: 13.5 degC (13.3)
Mean Min: 6.5 degC (6.3)
Mean: 10.0 degC (9.8)
Air Frosts: 1.2 days (1.6)
Sunshine: 98.9 hrs (102.8)
Rainfall: 63.4 mm (60.9)
Days rain: 11.8 days (11.3)
November
November has followed with 0.3 degC of warming. Nothing else has changed that much, with similar rainfall and sunshine totals.
Mean Max: 9.7 degC (9.4)
Mean Min: 3.6 degC (3.4)
Mean: 6.7 degC (6.4)
Air Frosts: 4.6 days (4.8)
Sunshine: 64.6 hrs (66.4)
Rainfall: 73.0 mm (72.0)
Days rain: 12.0 days (12.3)
December
December is now 0.4 degC warmer than in the 1981-2010 period, and is also sunnier, as well as being slightly wetter.
Mean Max: 7.1 degC (6.7)
Mean Min: 1.4 degC (1.1)
Mean: 4.3 degC (3.9)
Air Frosts: 10.4 days (11.0)
Sunshine: 57.6 hrs (51.2)
Rainfall: 61.0 mm (57.0)
Days rain: 12.0 days (11.7)
Annual
Mean Max: 13.2 degC (12.9)
Mean Min: 5.7 degC (5.4)
Mean: 9.5 degC (9.2)
Air Frosts: 46.8 days (51.5)
Sunshine: 1480.0 hrs (1445.4)
Rainfall: 675.7 mm (651.1)
Days rain: 124.1 days (122.0)
Overall, the year in Durham is now 0.3 degC warmer, with air frosts reducing by nearly 5 days on average. Durham has received 35 hrs more sunshine in the 1991-2020 period, but with 24.6 mm more rain as well.
When compared to the 1961-1990 averages, Durham has warmed by nearly a whole degree celsius, has 9 days less air frost, has nearly 150 hrs of extra sunshine and has 25mm less rain in the average year.
Source : https://www.metoffice.gov.uk/research/climate/maps-and-data/uk-climate-averages/gcwzefp2c
- Durham Live Weather Data Is Now Available
 The Eagle-eyed among you may have noticed a ‘Live Durham Weather’ option has appeared in the header bar. Clicking this will take you to the following page views. You’ll be …
 - How a Plastic Bin Fooled My Weather Station
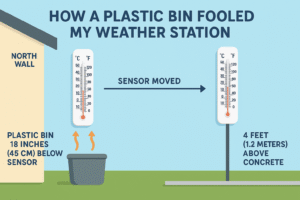 Sometimes, in the world of amateur meteorology, it’s not the technology that trips you up. It’s the humble bin. Yes, a bog-standard plastic bin. And not doing anything remotely interesting, …
 - Cathedrals, collieries, castles and coastlines
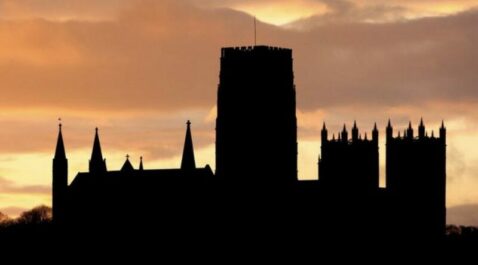
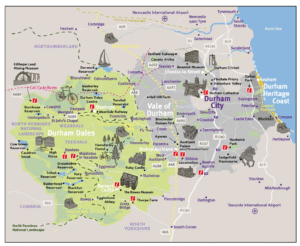 County Durham—my own stomping ground. It’s a place that doesn’t get nearly enough credit for its beauty, charm, and personality. Tucked neatly between Northumberland to the north and Yorkshire to …
 - Exploring the Serene Beauty of England’s River Wear
 Exploring the Serene Beauty of England’s River Wear Nestled within the picturesque landscapes of Northeast England, between the Tyne to the North and the Tees to the South, the River …
 - About our Visitors to Durham Weather
 What do people search for at Durham Weather? Here at Durham Weather, we are always interested in what others are searching for when they find us. The weather is of …
 - What are the most important things to consider when buying a weather station for the home?
 How to choose a Weather Station When buying a weather station for the home, there are several important things to consider: Accuracy: The most important feature of any weather station …