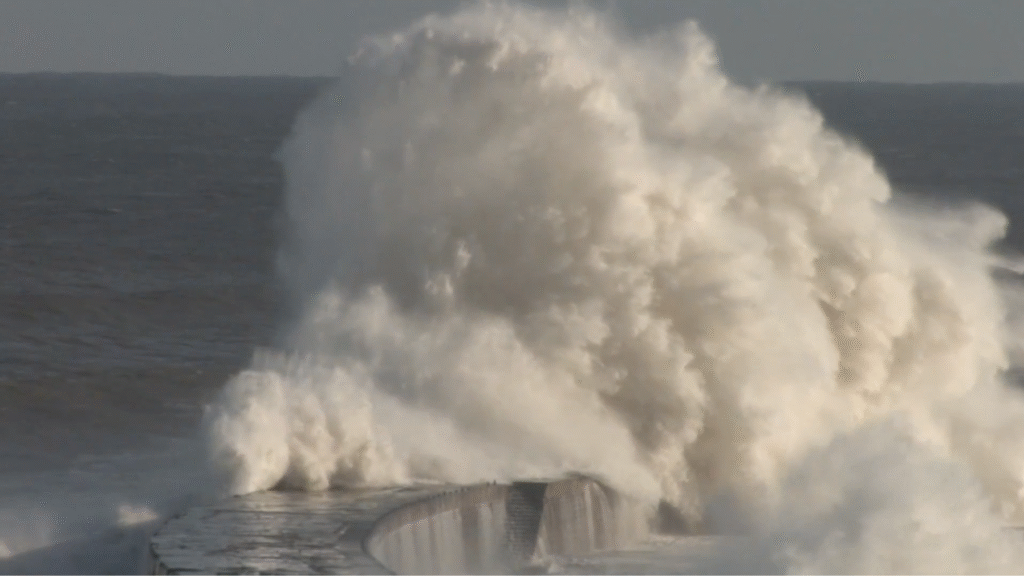
November 2024 Weather in Durham – Gloomy start, then stormy

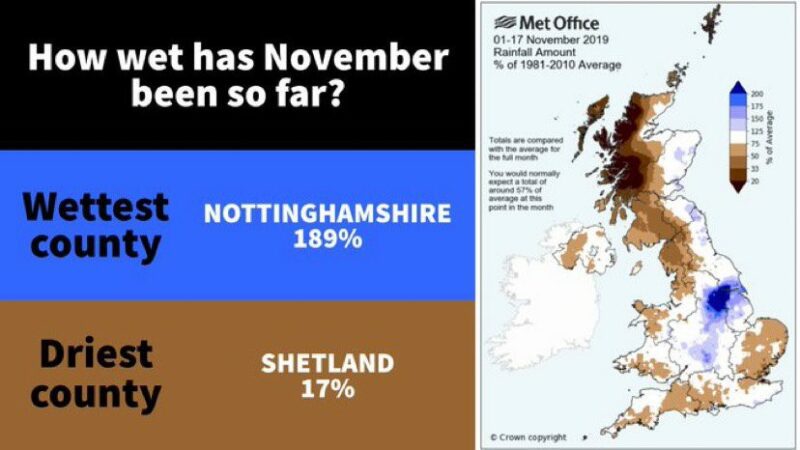
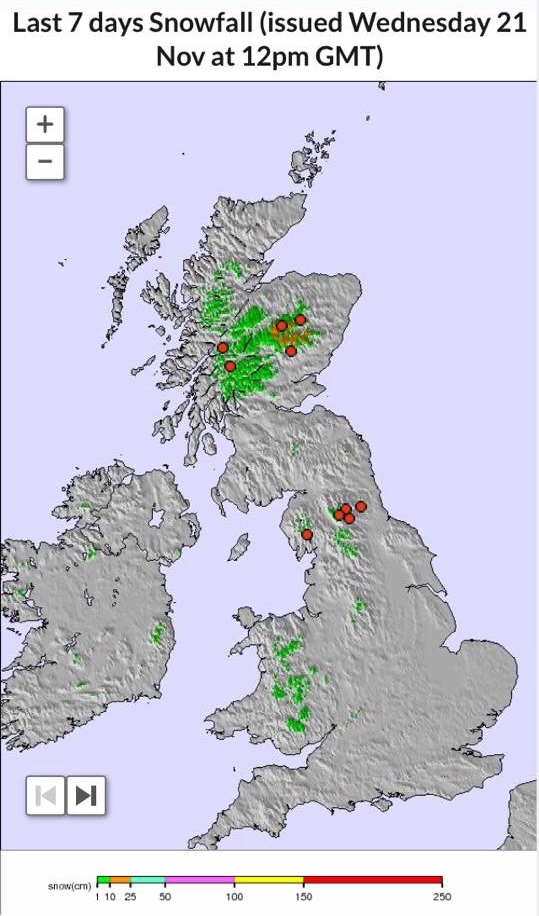
The first two weeks of November 2024 were marked by a large stationary anticyclone, giving “anticyclonic gloom”, with many areas particularly in the south being very dull, although dry (only 6% of the expected rainfall had fallen by the 16th). There was a notable northerly outbreak in the third week bringing snow to some areas and some sharp frost. The …