2025 in Durham – The Year So Far

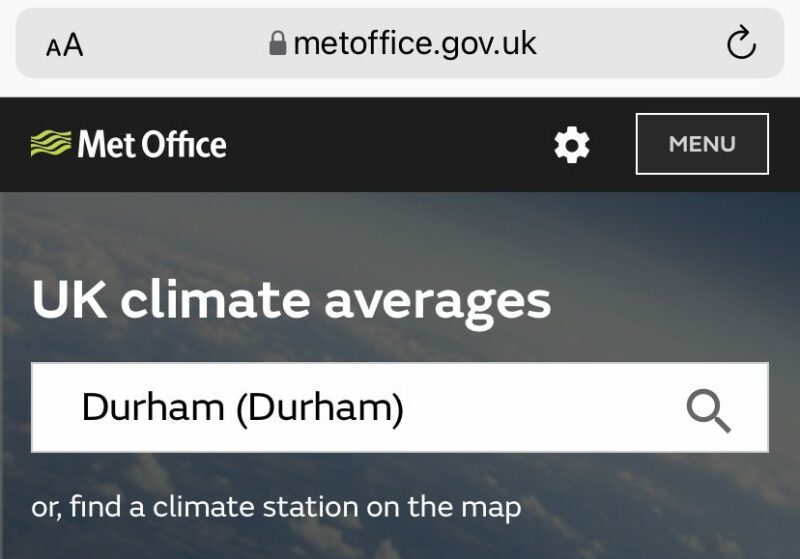
Here is the data for the year so far, from the official Durham University Observatory at Potters Bank. This is compiled by Professor Tim Burt here January 2025 January was a cool month. January 5th was the wettest January day on record (33.4 mm), beating the previous record which had stood since 12th January 1921 (32.8 mm). Mean daily maximum: …