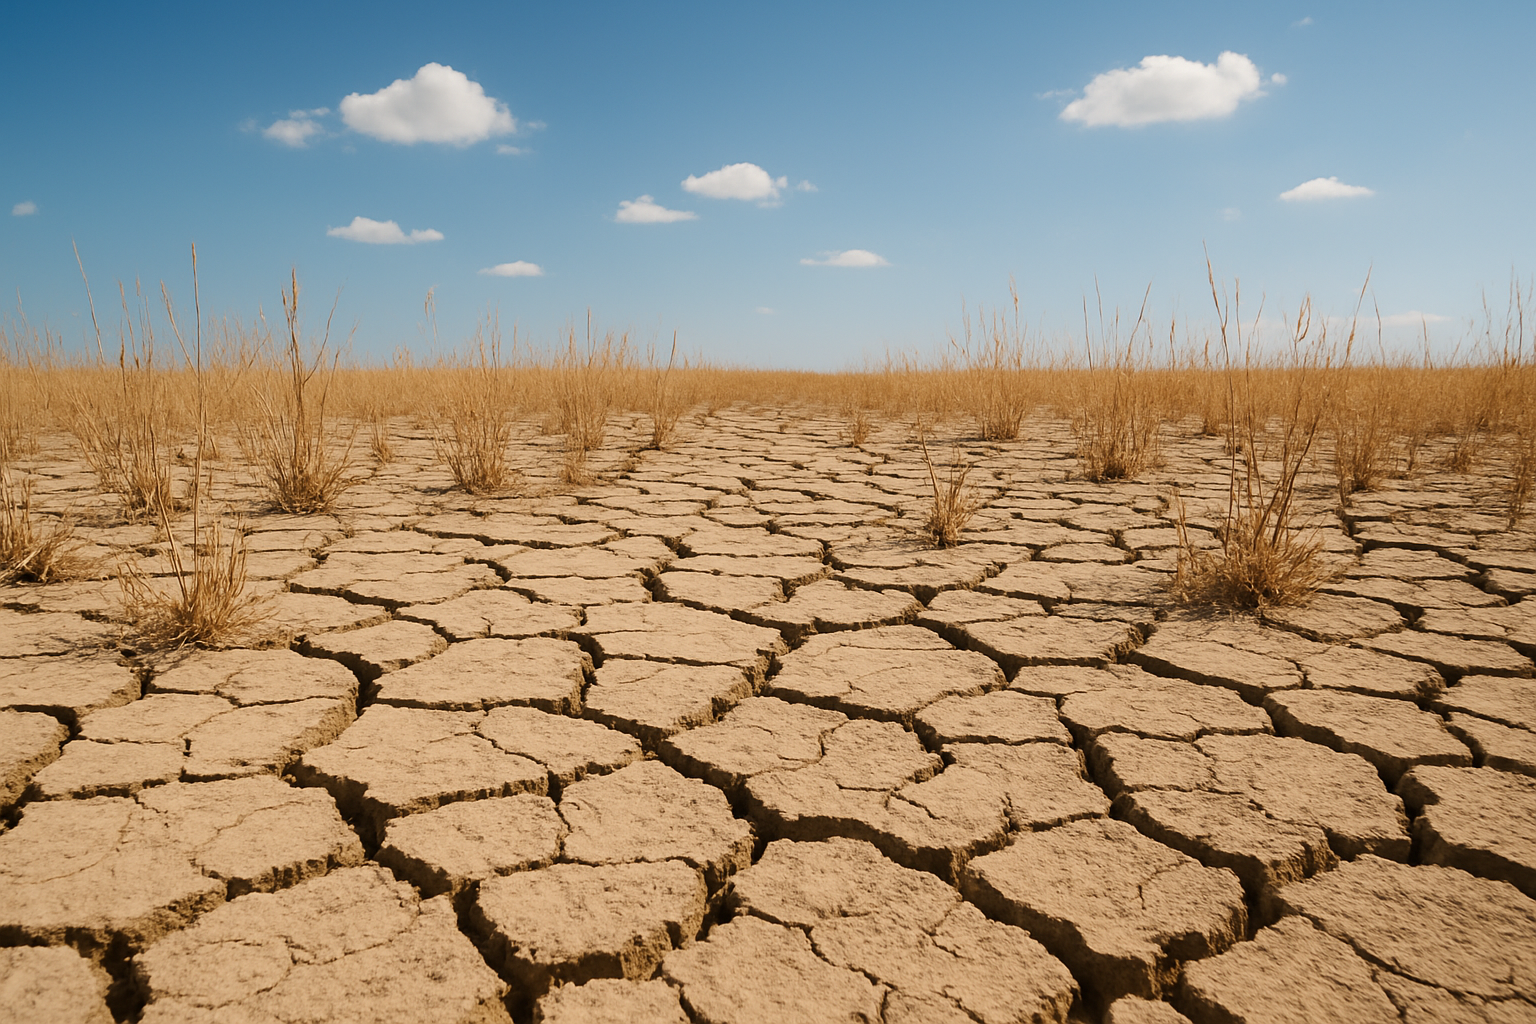
Has the dry Spring happened before?
After the phenomenally dry Spring this year, you might wonder whether this has happened before, and what was Durham’s driest year on record?
Normal yearly rainfall in Durham (based on the 1991-2020 climatic mean) is around the 680mm mark. Spaced out evenly over the year, that is about 57 mm per month. But, it isn’t usually evenly spaced; the Spring gets much less rain than the summer and autumn on average.
The normal means for the months (split into seasonal groups) are.
Winter (December, January and February) : 61.0, 51.8, 44.6 = 157.4 mm
Spring (March, April and May) : 41.1, 51.2, 44.4 = 136.7 mm
Summer (June, July and August) : 61.0, 60.9, 66.5 = 188.4 mm
Autumn (September, October, November) : 56.9, 63.4, 73.0 = 193.3 mm
So what were the totals in 1989?
For the purposes of this illustration, we’ll include December 1988 in the seasonal totals.
Winter 1988-89 (December, January and February) : 27.9, 7.2, 47.6 = 82.7 mm (53%)
Spring 1989 (March, April and May) : 20.7, 50.3, 7.7 = 78.7 mm (58%)
Summer 1989 (June, July and August) : 52.1, 10.1, 61.5 = 123.7 mm (66%)
Autumn 1989 (September, October, November) : 11.7, 48.5, 34.8 = 95.0 mm (49%)
The totals are just above the half way mark for the driest year.
How has this year started in comparison?
Winter 2024-25 (December, January and February) : 51.8, 61.0, 33.4 = 146.2 mm (93%)
Spring 2025 (March, April and May) : 20.8, 4.2, abt 25 = abt 50 mm (abt 37%)
The winter just gone wasn’t as dry as the one preceding the dry year of 1989, but the Spring this year has actually been drier.
The first half of June 2025 is forecast to be very showery and unsettled, so Durham may have something approaching a normal June total, but June 1989 was not particularly dry, so all is not lost if you’re looking for a new record. The Summer of 1989 featured a very dry and warm July, so this year will have to deliver 🙂
