
Join the Weather Lovers Community at Skool
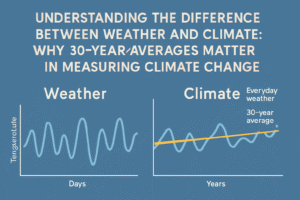
The latest 30 years means have been published by the Met Office. The period covers the 30 years between 1991-2020 and will be used going forward as a representative of climate norms. The figures show a warming of about 0.3 degC overall, particularly in late winter/spring, with a slight increase in sunshine, but also wetter, particularly the 2nd half of the year.
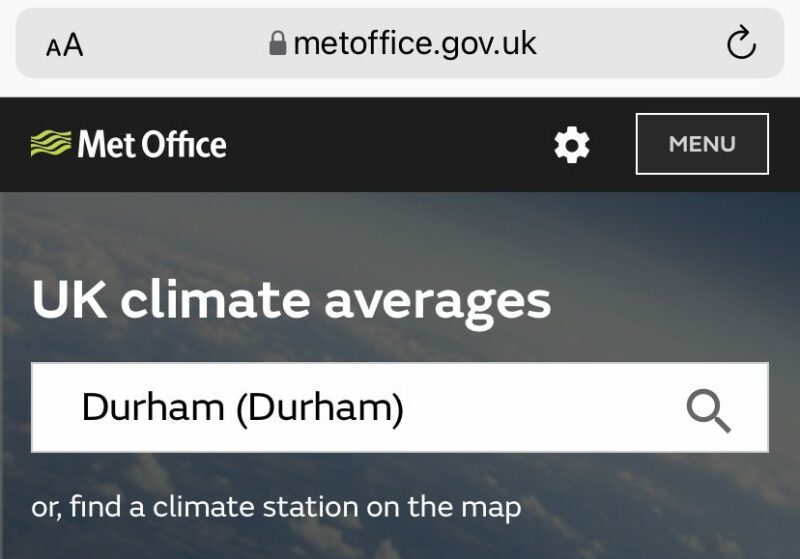
Durham’s new figures are below (previous 1981-2010 figures in parentheses)
January
January has warmed, and the mean maxima and minima are 0.3-0.4 degC higher. This has resulted in one day less air frost on average. Sunshine is up slightly, but rainfall is similar.
Mean Max: 6.9 degC (6.6)
Mean Min: 1.3 degC (0.9)
Mean: 4.1 degC (3.8)
Air Frosts: 10.3 days (11.3)
Sunshine: 60.9 hrs (58.6)
Rainfall: 51.8 mm (52.3)
Days rain: 11.8 days (11.4)
February
February has warmed substantially, with the mean maximum being 0.6 degC up from the 1981-2010 mean. The mean minimum is also 0.5 degC higher. This has resulted in a reduction of air frosts from 11.2 to 9.8 days on average. It has also become slightly sunnier and slightly wetter.
Mean Max: 7.8 degC (7.2)
Mean Min: 1.4 degC (0.9)
Mean: 4.6 degC (4.1)
Air Frosts: 9.8 days (11.2)
Sunshine: 84.4 hrs (80.3)
Rainfall: 44.6 mm (41.8)
Days rain: 9.9 days (9.3)
March
March shows a warming, more in the mean maximum than the mean minimum. This hasn’t made much difference to air frosts, but sunshine has increased and it is a little drier.
Mean Max: 9.9 degC (9.5)
Mean Min: 2.5 degC (2.3)
Mean: 6.2 degC (5.9)
Air Frosts: 6.5 days (6.7)
Sunshine: 121.7 hrs (115.5)
Rainfall: 41.1 mm (44.6)
Days rain: 8.6 days (9.7)
April
April has become markedly warmer, particularly in the mean maximum. The high is now 0.6 degC higher. This means that air frosts are now down to 3 days from 4. Aprils have also been sunnier, with little change in rainfall.
Mean Max: 12.5 degC (11.9)
Mean Min: 4.1 degC (3.7)
Mean: 8.3 degC (7.8)
Air Frosts: 3.2 days (3.9)
Sunshine: 160.8 hrs (150.3)
Rainfall: 51.2 mm (52.7)
Days rain: 9.1 days (9.5)
May
May has followed the trend of warming, with both max and min being up by 0.4 degrees on average. We can still expect one air frost on average. Again, sunshine is slightly up, but there has been little change to rainfall.
Mean Max: 15.4 degC (15.0)
Mean Min: 6.5 degC (6.1)
Mean: 11.0 degC (10.5)
Air Frosts: 0.8 days (0.8)
Sunshine: 187.1 hrs (181.7)
Rainfall: 44.4 mm (44.2)
Days rain: 8.6 days (9.2)
June
June temperatures are up by 0.3-0.4 degC on average and it has become slightly wetter.
Mean Max: 18.0 degC (17.6)
Mean Min: 9.3 degC (9.0)
Mean: 13.7 degC (13.3)
Air Frosts: 0.0 days (0.0)
Sunshine: 167.1 hrs (164.8)
Rainfall: 61.0 mm (55.4)
Days rain: 9.9 days (9.7)
July
July hasn’t shown much change other than a slight increase in mean minimums, but has become slightly wetter and rain comes on two more days.
Mean Max: 20.2 degC (20.1)
Mean Min: 11.3 degC (11.1)
Mean: 15.8 degC (15.6)
Air Frosts: 0.0 days (0.0)
Sunshine: 174.3 hrs (172.3)
Rainfall: 60.9 mm (54.0)
Days rain: 10.7 days (9.0)
August
Again, the slight increase in temperature in August is due to the mean minimum, with a similar effect to July, a slight increase in rainfall and an average of nearly a day extra with rainfall.
Mean Max: 19.9 degC (19.8)
Mean Min: 11.3 degC (11.0)
Mean: 15.6 degC (15.4)
Air Frosts: 0.0 days (0.0)
Sunshine: 167.3 hrs (167.3)
Rainfall: 66.5 mm (60.8)
Days rain: 10.3 days (9.6)
September
September is slightly warmer by 0.3 degC, but other than that the other parameters haven’t changed.
Mean Max: 17.4 degC (17.2)
Mean Min: 9.3 degC (9.0)
Mean: 13.4 degC (13.1)
Air Frosts: 0.0 days (0.0)
Sunshine: 135.3 hrs (134.5)
Rainfall: 56.9 mm (55.4)
Days rain: 9.4 days (9.3)
October
October has warmed slightly and has become slightly duller, with an extra day of rain on average.
Mean Max: 13.5 degC (13.3)
Mean Min: 6.5 degC (6.3)
Mean: 10.0 degC (9.8)
Air Frosts: 1.2 days (1.6)
Sunshine: 98.9 hrs (102.8)
Rainfall: 63.4 mm (60.9)
Days rain: 11.8 days (11.3)
November
November has followed with 0.3 degC of warming. Nothing else has changed that much, with similar rainfall and sunshine totals.
Mean Max: 9.7 degC (9.4)
Mean Min: 3.6 degC (3.4)
Mean: 6.7 degC (6.4)
Air Frosts: 4.6 days (4.8)
Sunshine: 64.6 hrs (66.4)
Rainfall: 73.0 mm (72.0)
Days rain: 12.0 days (12.3)
December
December is now 0.4 degC warmer than in the 1981-2010 period, and is also sunnier, as well as being slightly wetter.
Mean Max: 7.1 degC (6.7)
Mean Min: 1.4 degC (1.1)
Mean: 4.3 degC (3.9)
Air Frosts: 10.4 days (11.0)
Sunshine: 57.6 hrs (51.2)
Rainfall: 61.0 mm (57.0)
Days rain: 12.0 days (11.7)
Annual
Mean Max: 13.2 degC (12.9)
Mean Min: 5.7 degC (5.4)
Mean: 9.5 degC (9.2)
Air Frosts: 46.8 days (51.5)
Sunshine: 1480.0 hrs (1445.4)
Rainfall: 675.7 mm (651.1)
Days rain: 124.1 days (122.0)
Overall, the year in Durham is now 0.3 degC warmer, with air frosts reducing by nearly 5 days on average. Durham has received 35 hrs more sunshine in the 1991-2020 period, but with 24.6 mm more rain as well.
When compared to the 1961-1990 averages, Durham has warmed by nearly a whole degree celsius, has 9 days less air frost, has nearly 150 hrs of extra sunshine and has 25mm less rain in the average year.
Source : https://www.metoffice.gov.uk/research/climate/maps-and-data/uk-climate-averages/gcwzefp2c
- Weather vs Climate: Why 30-Year Averages Are the Key to Spotting Real Change
 Join the Weather Lovers Community at Skool This is one of those questions that seems simple on the surface, but when you scratch the surface a bit, it opens up …
 - Is Net Zero “Virtue-Signalling Tripe”? – DCC think so!
 Join the Weather Lovers Community at Skool If governments choose to deny or abandon mitigation of climate change, things will almost certainly get worse—and quicker too. The planet isn’t waiting …
 - The Grace Darling Storm – 7th September 1838
 Join the Weather Lovers Community at Skool The Grace Darling storm – it’s the storm that immortalised a young woman and her father as national heroes, and it’s forever tied …
 - Durham Miners Gala Forecast
 Join the Weather Lovers Community at Skool Durham Miners’ Gala 2025 Weather Forecast – Saturday 12th July “Leave the brolly at home – you won’t need it.” For once, we’ve …
 - New Weather Maps Page!
 Join the Weather Lovers Community at Skool Introducing a new page to the site. The Weather Map Page We have added the following info, all of which can be viewed …
 - Durham Live Weather Data Is Now Available
 Join the Weather Lovers Community at Skool The Eagle-eyed among you may have noticed a ‘Live Durham Weather’ option has appeared in the header bar. Clicking this will take you …
Join the Weather Lovers Community at Skool